
Results
We read all 23,451 Horizon Europe projects and asked a simple question: which of the 17 UN Sustainable Development Goals does each one work on? Here are the answers, in charts and short text. Where a chart can't show how goals hang together, we add network views from Dtangle, our visual analytics tool. You don't need the Explorer or Dtangle to follow along; they're here if you want to dig further (section 5).
Same two-step filtering as the Explorer
Rates one concept in one project (title or aim 1.00, keywords 0.80, and so on, added up). The concepts found under this score are dropped first, and every chart is rebuilt from the concepts that remain (Explorer filter 1).
Rates one project for one goal: the concept scores left after step 1 that serve the goal, added up, plus the Commission's structural points. A project–goal link is kept when it reaches the value (Explorer filter 4). Applies to the goals, targets and countries charts; the concept charts of part 3 use step 1 only. Elsewhere on this page, Score ≥ 2.00 means pertinence ≥ 2.00.
How a project gets linked to a goal
Where a concept is found decides its points; a project's score for a goal adds up its concepts, plus up to 1.20 from the Commission's own classification.
We wrote a list of 251 concepts, from aquaculture to drought to cancer, each tied to one or more of the goals' targets. Then we look for them in every project: title, objective, keywords, call topic and acronym. Where a concept shows up decides how many points it earns.
| Where the concept is found | Points |
|---|---|
| Title, or an objective sentence stating the project's aim | 1.00 |
| An objective sentence about expected impact | 0.90 |
| An objective sentence about method, or the keywords | 0.80 |
| An objective sentence giving context, or the call topic | 0.70 |
| A speculative sentence (“could”, “in the long term”), or the acronym | 0.60 |
| Bonus when the objective keeps coming back to it (2 to 3 sentences / 4 or more) | +0.25 / +0.50 |
A concept counts only if it appears in a strong place (0.80 or more) or in two places. The score of a project for a goal is the sum of the points of its concepts serving that goal, plus up to 1.20 when the Commission's own classification points the same way (climate or biodiversity tracking, programme or mission, research field).
Two real projects:
- INNOAQUA has aquaculture in its title (1.00) and in the sentence stating its aim (1.00): 2.00 for SDG 2, zero hunger.
- BOOSTER, on drought-tolerant cereals, has drought in its title (1.00), its aim (1.00), four or more sentences (+0.50) and its keywords (0.80), so 3.30; irrigation in its aim adds 1.00 and its research field (water engineering) 0.30: 4.60 for SDG 6, clean water.
So the score tells how much, and how centrally, a project talks about a goal. It says nothing about the impact the project will have.
The 251 concepts are also grouped into 128 broad concepts. Air pollution and health, chemical exposure and toxic substances and water and soil contamination affecting health, for example, make up environmental health. At broad level, the fine concepts a project mentions are merged by broad concept: the merged concept keeps the goals of the fine concepts found and adds up their scores. Links between projects and goals, and their scores, stay the same; what changes is which concepts count as separate evidence, the concept graph and funding per concept.
Key findings
Five findings with their numbers, and why 2.00 and 4.00 are the thresholds.
- Three in four projects (17,437) work on at least one goal. The other 6,014 are mostly fundamental research (ERC and MSCA grants) where we find no goal.
- Many projects touch several goals. Counting every link, 11,345 of the 17,437 linked projects (65 %) touch two goals or more, 2.8 on average. The stricter the score, the fewer goals per project: of the 11,581 projects with at least one goal at 2.00 or more, 5,066 (44 %) have two such goals or more, 1.7 on average; of the 5,568 projects with a goal at 4.00 or more, 1,087 (20 %) do, 1.2 on average.
- Health, climate and consumption come first. Counting only the projects that are really about a goal (score 2.00 or more): SDG 3 (4,465 projects), SDG 13 (2,063) and SDG 12 (1,934). Partnerships (SDG 17, 119), education (SDG 4, 185) and poverty (SDG 1, 205) get the least attention.
- Some goals go together. Climate and life on land (SDG 13 × 15) meet most often: 333 projects with separate evidence for each (495 counting all), and they still lead at 4.00 or more (114). Cities and climate (SDG 11 × 13) share more projects, 746, but only 321 of them with separate evidence for both goals. Peace and justice with gender equality (SDG 16 × 5) pull hardest towards each other: 77 projects work on both, 3.54 times what chance would give, 65 of them with separate evidence for each.Energy and climate (SDG 7 × 13) meet most often: 317 projects with separate evidence for each (358 counting all), just ahead of climate and life on land (SDG 13 × 15, 307), which lead at 4.00 or more (102). Cities and climate (SDG 11 × 13) share more projects, 746, but only 289 of them with separate evidence for both goals. Peace and justice with gender equality (SDG 16 × 5) pull hardest towards each other: 77 projects work on both, 3.54 times what chance would give, 65 of them with separate evidence for each.
- The money goes to a few topics. Counting only the concepts a project is really about (concept score 2.00 or more), €27.6 bn of EU contribution can be attributed to concepts, across 8,417 projects. The 20 best-funded concepts take 48 % of it, led by cancer (€1.87 bn), renewable hydrogen and e-fuels (€0.99 bn) and cutting greenhouse gas emissions (€0.99 bn).The 20 best-funded broad concepts take 59 % of it, led by cancer (€1.87 bn), the circular economy (€1.69 bn) and bioenergy and renewable fuels (€1.20 bn).
2.00 is validated by the method. It is the score of a concept that stands both in the title and in the stated aim, as in INNOAQUA, or of two concepts each in a strong place: the project is about the goal, not just mentioning it. On a blind reading of 60 projects, it is the threshold with the best balance: 56 % of its links confirmed by the reader and 76 % of the reader's goals found (F1 0.65, against 0.48 for all links and 0.53 at 4.00; see Measured precision).
4.00 is confirmed by the Commission. When the text alone scores 4.00 or more, 73 % of the links also carry the Commission's own classification of the project pointing to the same goal (climate or biodiversity tracking, programme or mission, research field), against 50 % between 2.00 and 4.00 and 31 % below 2.00. Our reading of the text and the Commission's classification, made independently, agree. On the blind reading, 71 % of the links scored 4.00 or more were confirmed (81 % on the pilot).
1 · Goals
Projects per goal
How many projects each goal gets, and its share of all project–goal links.
Each slice is one goal's share of all project–goal links: a project linked to three goals counts once in each, so the slices add up to 100 %. The legend also gives the number of projects per goal and their share of the 23,451 Horizon Europe projects; those shares add up to more than 100 %, since most projects touch several goals. Hover a slice or a goal for its figures.
Goals that travel together
Which goals the same projects work on, with independent evidence: heatmap, network and table.
One caution before reading pairs. 41 %43 % of the goal pairs come from a single concept that serves two goals at once: air pollution serves health (3.9) and cities (11.6), so every project on air pollution links SDG 3 and SDG 11. The project does serve both goals, but the pair was written into the concept table before any project was read: counting it shows how popular the concept is, not a combination the project chose. By default the charts below count only independent evidence: a project counts for a pair when one of its concepts serves the first goal and not the second, and another serves the second and not the first. Switch to raw to count every project linked to both goals and see how much the picture changes.
How the pairs are measured
Four numbers describe a pair of goals. The example is health and cities (SDG 3 × SDG 11), all links, where 17,437 projects are linked to at least one goal, 7,918 of them to SDG 3 and 5,071 to SDG 11.
| Measure | What it counts | What it means | SDG 3 × 11 |
|---|---|---|---|
| Shared projects (raw) | projects linked to both goals | how often the two goals appear in the same project, whatever the reason | 2,015 |
| Independent evidence | projects with one concept serving the first goal and not the second, and another serving the second and not the first | how often a project combines two separate subjects, not one concept filed under two goals | 510505 |
| Expected count | projects of the first goal × projects of the second ÷ all projects: 7,918 × 5,071 ÷ 17,437 | the number of shared projects if being linked to one goal said nothing about the other; big goals meet often by size alone | 2,303 |
| Lift | shared projects (raw) ÷ expected count: 2,015 ÷ 2,303 | the chance reference: 1 means as often as chance, 2 twice as often, 0.5 half as often | 0.88 |
| Lift index | independent evidence ÷ expected count: 510505 ÷ 2,303 | used only to rank pairs against each other. Its numerator is a stricter count than the one behind the expected count, so it sits at or below the lift and its 1 is not the chance level | 0.22 |
Ratios on few projects swing widely, so the lift rankings and the graph keep pairs with at least 30 shared projects (15 in the score ≥ 4.00 series; 20 and 10 for targets).
Chart: projects with independent evidence for both goals
Graph: the strongest pairs
The graph can weigh its edges two ways, and they answer different questions. Shared projects is the volume: the thicker the edge, the more projects work on both goals. Big goals win here almost by default: consumption and climate (SDG 12 × 13) get the thickest edge, 1,3751,374 projects, largely because both goals are big. Lift takes size out of the picture: the thicker the edge, the more often the two goals meet compared with what their sizes alone would give. Gender and inequalities (SDG 5 × 10) share only 277 projects, but that is 2.65 times the expected count, so they get the thickest edge there, while 12 × 13 shrinks to an average one. In short: shared projects shows where the projects are, lift shows which goals attract each other. (Examples: all links, independent evidence.)
2 · Targets
Projects per target
Projects per target, grouped by goal.
Targets that travel together
Which targets the same projects work on: network and table.
The same reading one level down. With independent evidence, targets linked only through one shared concept are set aside; the raw count keeps them. Pairs within the same goal are shown in the chart but left out of the “unexpected” list, where they are expected by design.
Targets are placed around the circle by goal, coloured by goal; hover a target to see its links. Edge width works as for goals: shared projects shows the volume (targets 3.4 and 3.b, non-communicable diseases and medicines R&D, share the most projects), lift shows which targets attract each other beyond their size.
3 · Concepts
Concepts, targets and goals
How many concepts describe each goal, and a graph linking each target to its concepts.
The 251 concepts (grouped into 128 broad concepts) are the vocabulary between the goals and the projects. Some goals are described by many concepts, health first; 66 targets rest on a single concept.75 targets rest on a single broad concept.
Graph: targets and their concepts
Four ways to weigh an edge. All projects: every project where the concept is found counts 1. Pertinent projects: only projects whose score for this goal is 2.00 or more count, i.e. projects really about the goal (the Score ≥ 2.00 series); the concept itself may score less. Very pertinent projects: only projects where the concept scores 2.00 or more count, i.e. the project is about it. Sum of scores: each project counts for its concept score, so INNOAQUA's aquaculture (2.00) weighs more than a mention in the keywords alone (0.80). Some concepts carry many projects that only mention them; the last three views show where the substance is.
Projects, concepts and funding
Each project's EU contribution followed through its concepts: the 20 best-funded concepts.
Each project's EU contribution is shared across its concepts in proportion to their scores (Methodology, section 7), so the amounts add up to the €49.9 bn granted to the projects with a concept link. The 20 best-funded concepts carry 42 % of it. The number of projects and the money do not rank the same way: Aviation and maritime decarbonisation has 91 projects but €740 m, about €8 m per project, the mark of large industrial partnerships.The 20 best-funded broad concepts carry 53 % of it. The number of projects and the money do not rank the same way: Transport decarbonisation has 160 projects but €924 m, about €5.8 m per project, the mark of large industrial partnerships.
The other end of the scale, concepts with few, shallow, concentrated or ending projects, is the white space: see the White space angle of the explorer and Methodology, section 7.
Countries: where the money goes
EU contribution received by each country's participants: share, top 20 and one country in detail.
The EU pays its contribution to the organisations taking part, so each country here is the money its participants receive, not money the country puts in. We follow it the same way as above: from the project to its concepts, then to the targets those concepts serve. With all links, the €49.9 bn reach 188 countries, but five of them take more than half (Germany, Spain, France, Italy and the Netherlands, 52 %).
Share of the money by country
The eight countries named keep their colour whatever the setting; every other country is in grey.
The 20 countries receiving the most
One country in detail
By goal
By funding scheme
Top 10 targets
Every figure here comes from the Countries and Country funding flow angles of the explorer, with all goals selected; open them there to filter by goal, concept or country and export the CSV.
Institutions per goal
The ten institutions that receive the most EU money for each goal, weighted by how much each project is about that goal.
An institution's score for a goal adds up, over the projects linked to that goal, the EU contribution the institution receives in the project (netEcContribution in CORDIS) multiplied by the project's share for the goal: its pertinence for the goal divided by its pertinence summed over all goals. A university that receives €1 m in a project scoring 6.00 for SDG 3 and 2.00 for SDG 13 counts €0.75 m for SDG 3 and €0.25 m for SDG 13. Money and the semantic weight of each project are therefore combined; the same caveat applies as for any allocation (see Scientific rigour).
Projects: projects of the goal the institution takes part in; Coord.: of them, coordinated. Institutions are named as in CORDIS, so one body may appear under two legal entities (a national research centre and its institutes, for example). The two filters at the top apply.
In Dtangle
The same results explored in Dtangle, with captures and the steps to reproduce them.
Here is what the results look like in Dtangle, at two levels. The advantage Dtangle brings is that navigation is interactive and follows your context: instead of fixed charts, you explore the interconnected data at will, facet by facet, starting from the question or the angle you have in mind, whether a goal, a target or a concept. Click a picture to open the study and explore it yourself.
A few steps are enough to reproduce these views, or build your own:
- Open the study. Click a picture below, or sign in at trials.dtangle.ch with
cordis@dtangle.chand the passwordsdgmap. - Select a node. Click a goal, a target or a concept. The selection shows at the bottom of the graph (“1 nodes”), and View all brings the whole graph back at any time.
- Expand its nodes. With the node selected, use Expand nodes in the toolbar under the graph: its neighbours appear. From a concept you get its targets, from a target its concepts, from a goal its targets.
- Open the graph settings. In the side panel, go to Options, then the Edges section. Set Edge color to Weight: each edge is coloured by the number of projects behind it, from light (few) to dark red (many).
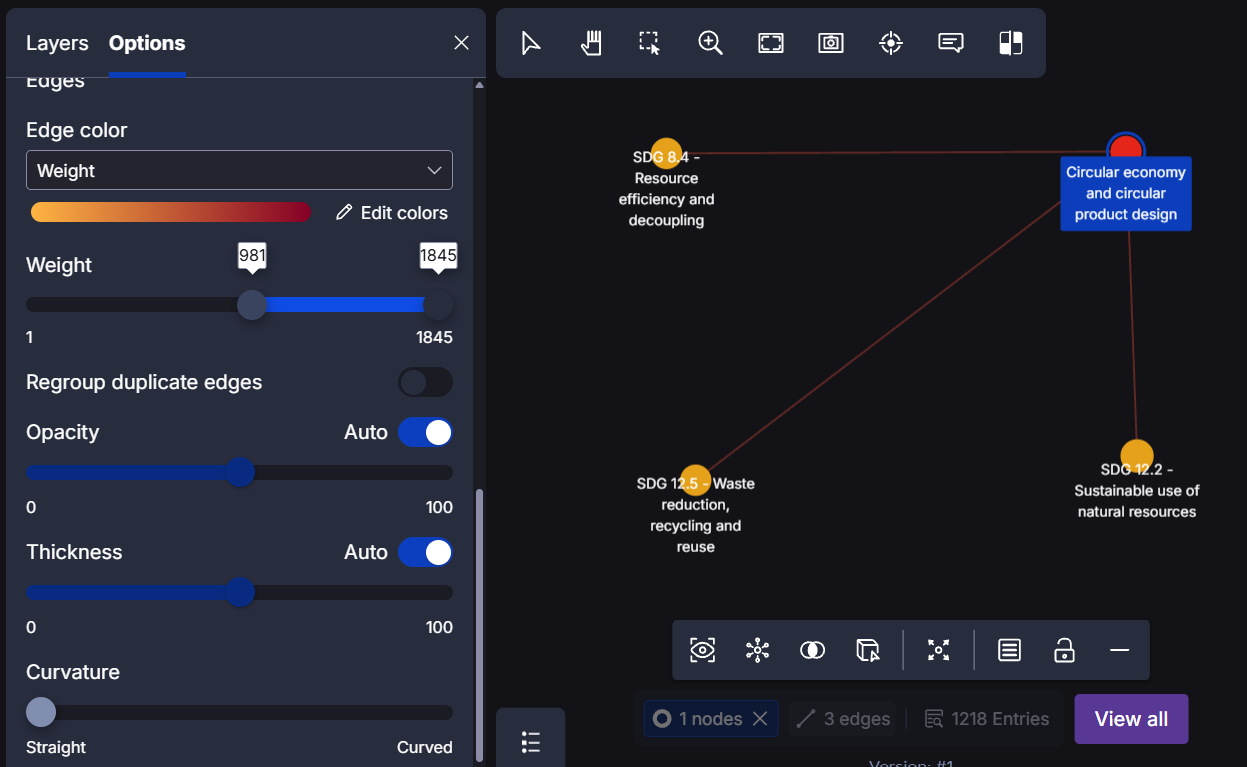
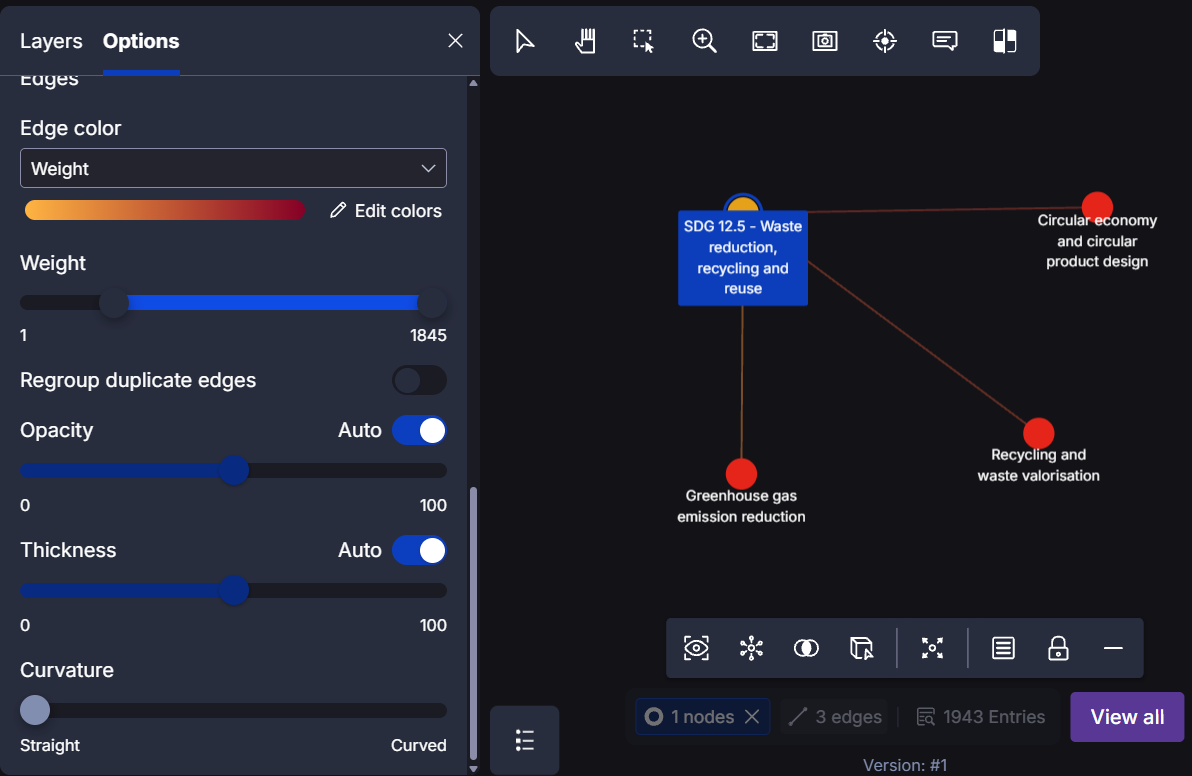
- Filter by weight. Drag the left handle of the Weight slider to the right. Edges below that number of projects disappear and only the strongest links stay: 981 for the circular economy view, 363 for SDG 12.5. Drag it back to 1 to see everything again.
The most important navigation options are described in the Dtangle documentation. If you need help, the Dtangle team is always available at contact@dtangle.ch.
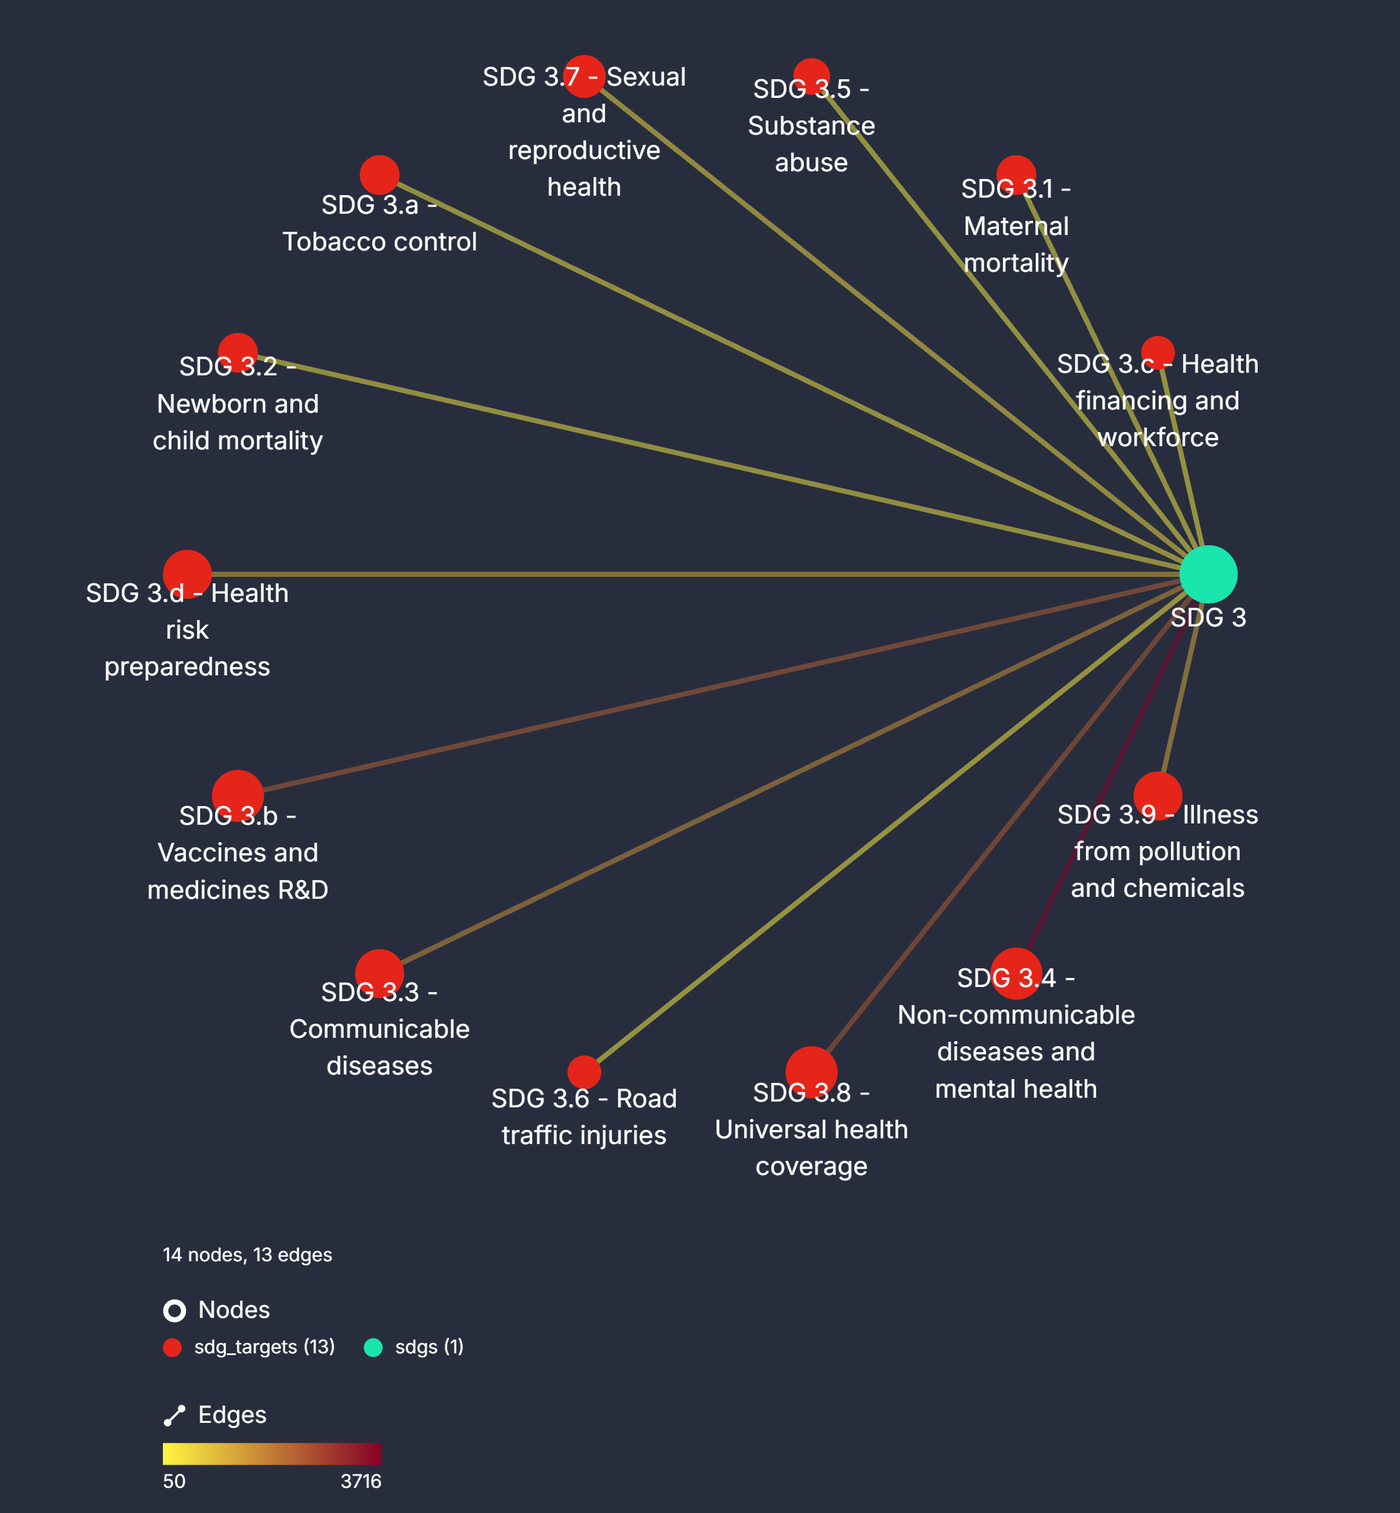
A goal and its targets. SDG 3 (health) sits on the right and each of its 13 targets is linked to it. The edge colour gives the number of projects, from 50 to 3,716.
 Open in Dtangle
A concept and its targets. In Dtangle you can pick any concept of the study, expand its neighbouring nodes to show the targets its projects are linked to, then keep only the most pertinent links by filtering on the edge weights. For example, Circular economy and circular product design reaches 134 targets in all, but only three keep their link when we ask for at least 981 shared projects: 8.4 (resource efficiency and decoupling), 12.2 (sustainable use of natural resources) and 12.5 (waste reduction, recycling and reuse).
Looking back, that is the expected answer. A circular economy keeps materials in use for longer: less goes to waste (12.5), fewer raw materials are drawn from nature (12.2), and the economy can grow without consuming more resources (8.4). Two of the three targets belong to SDG 12, responsible consumption and production, the goal where circularity is at home. The long tail of weaker links is real but secondary, and the filter separates it from the core.
 Open in Dtangle
A target and its concepts. Alternatively, you can start from a target, expand its nodes to see which concepts are related to it, and again filter by pertinence using the edge weights. Here, for instance, we keep the links of SDG 12.5 (waste reduction, recycling and reuse) that at least 363 projects share. Three concepts remain: Circular economy and circular product design, Recycling and waste valorisation and Greenhouse gas emission reduction.
Here too the result reads naturally. Recycling and waste valorisation is the target itself put into practice, and circular economy is the wider frame it belongs to, which is why the same link appears from both directions. Greenhouse gas emission reduction is less obvious at first sight, but waste and climate go hand in hand: landfills release methane, and every recycled material avoids the emissions of producing it new. Many projects pursue both aims at once, and the graph shows it.
 Open in Dtangle
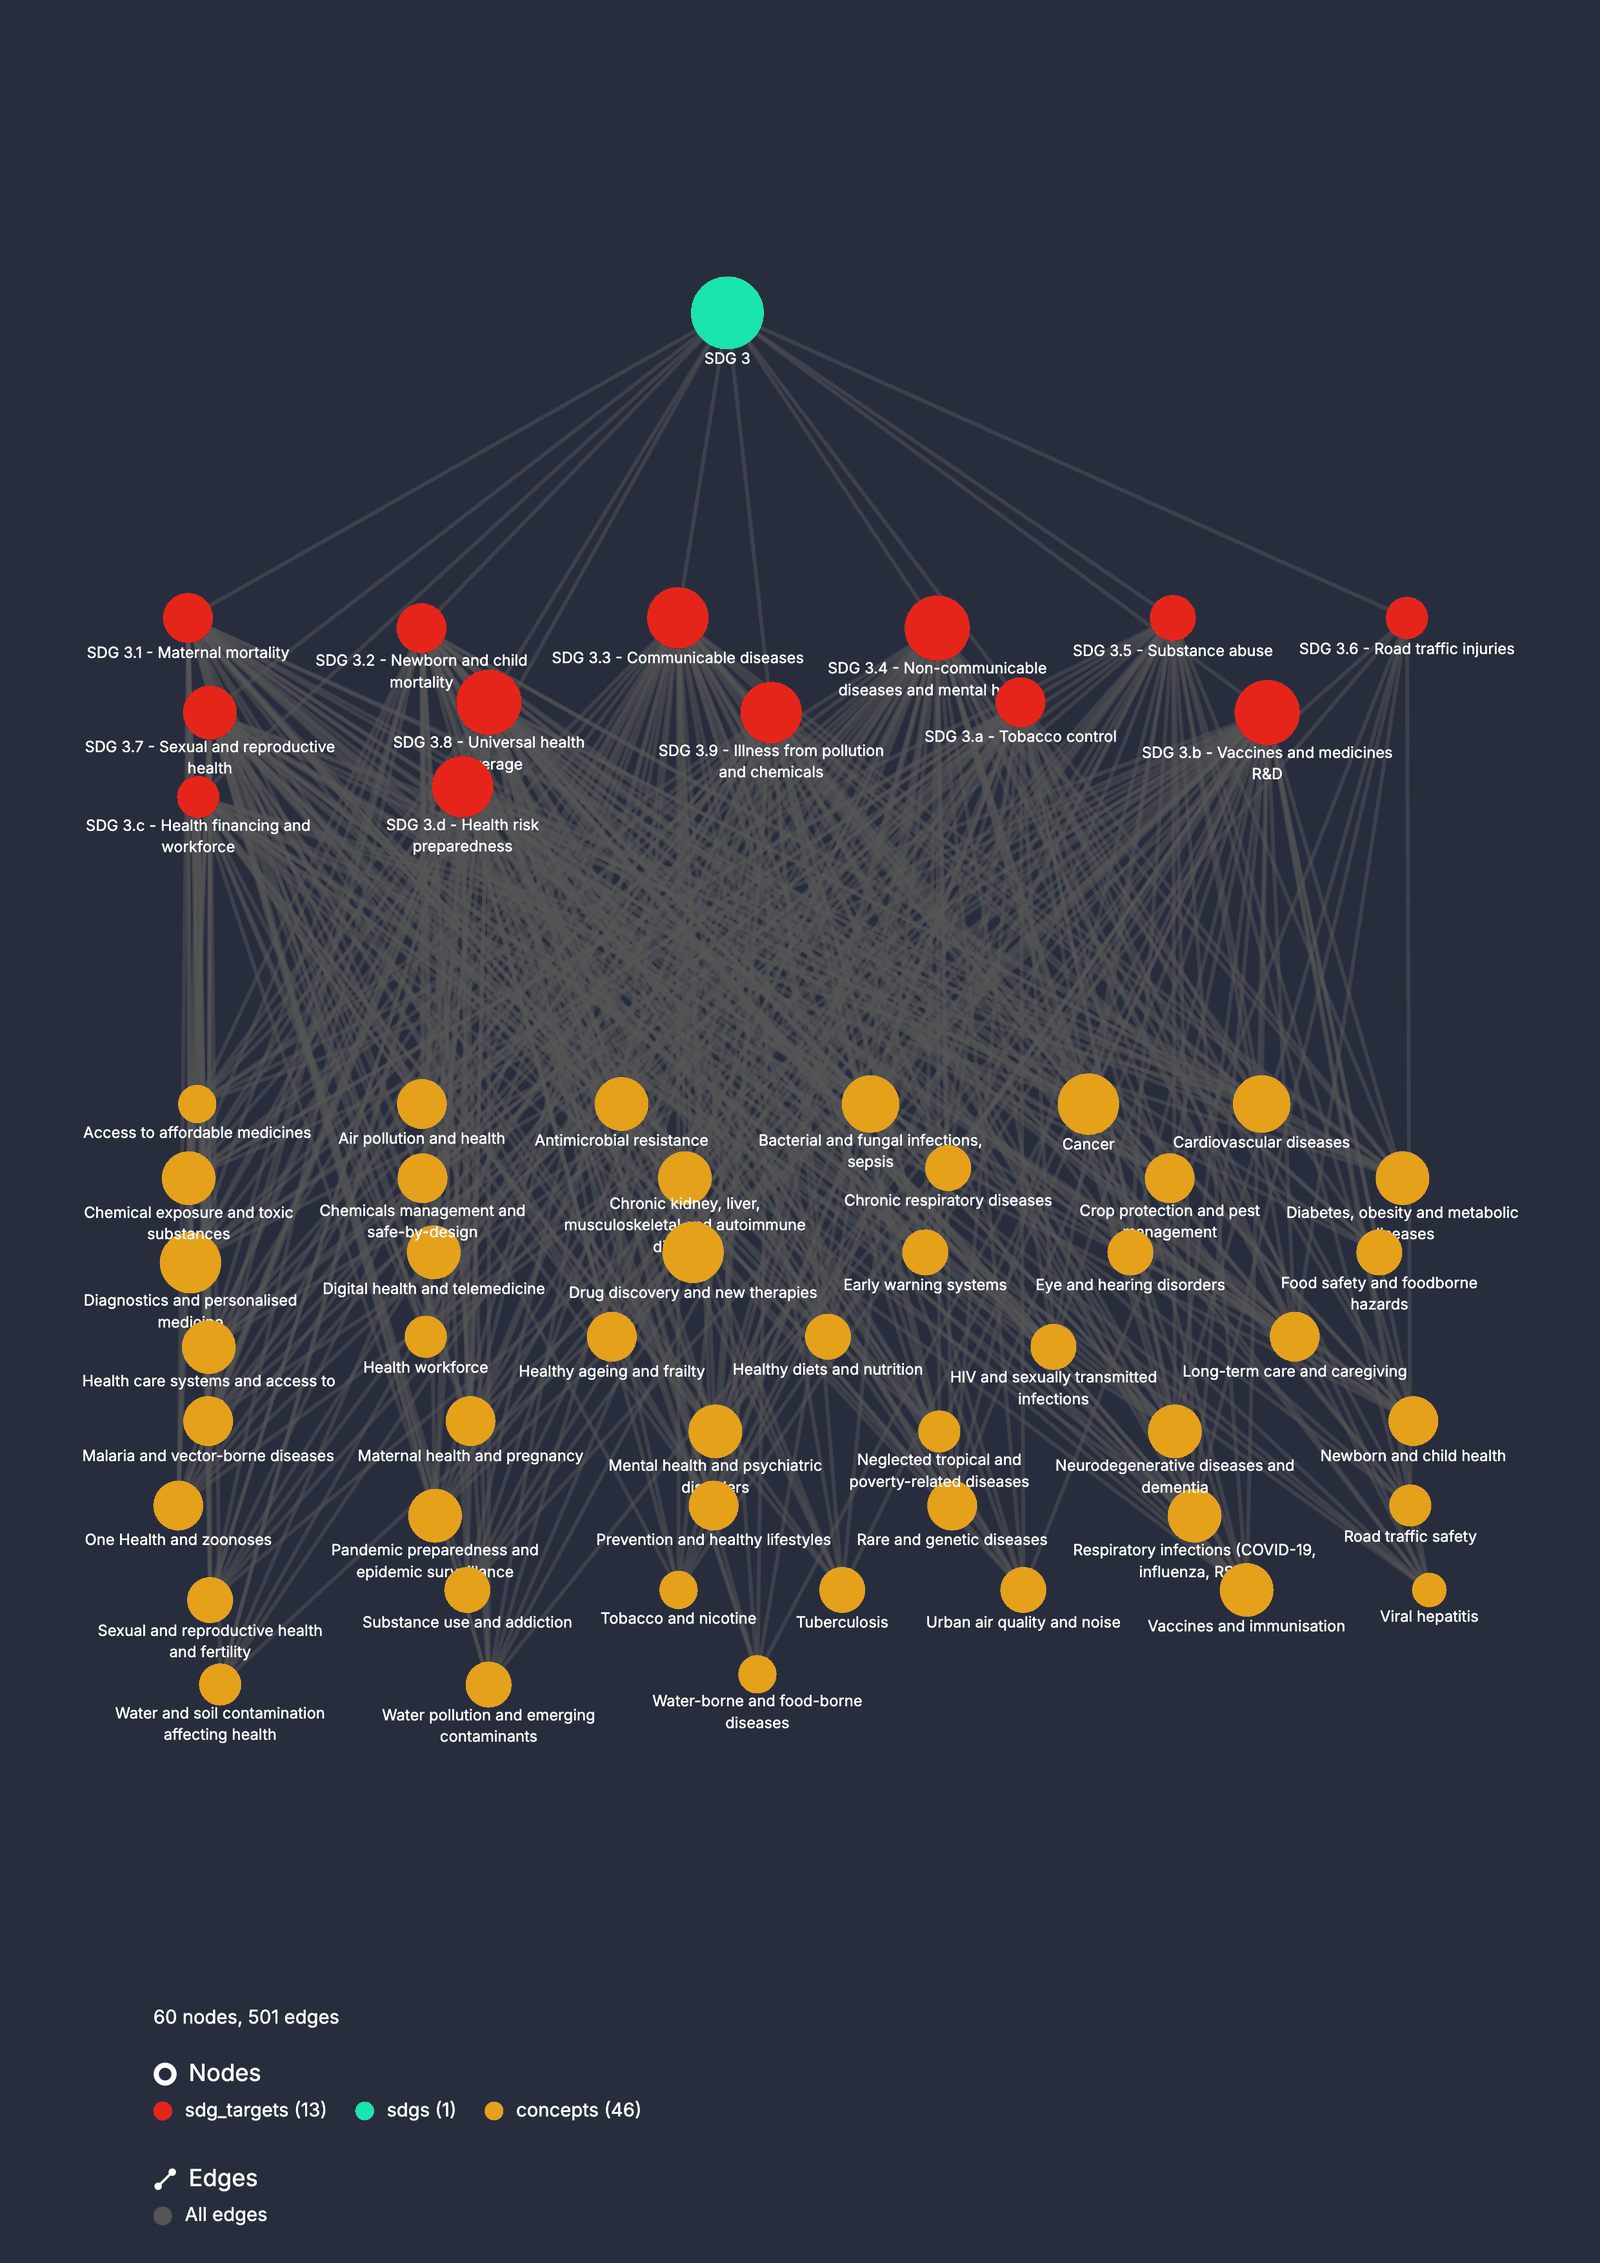
A goal, its targets and their concepts. Expand SDG 3 a second time and the whole vocabulary of health research appears under its targets: 13 targets, 46 concepts, 501 links. The three layers of the reading grid are on one screen, and every edge is a set of projects you can list.
 Open in Dtangle
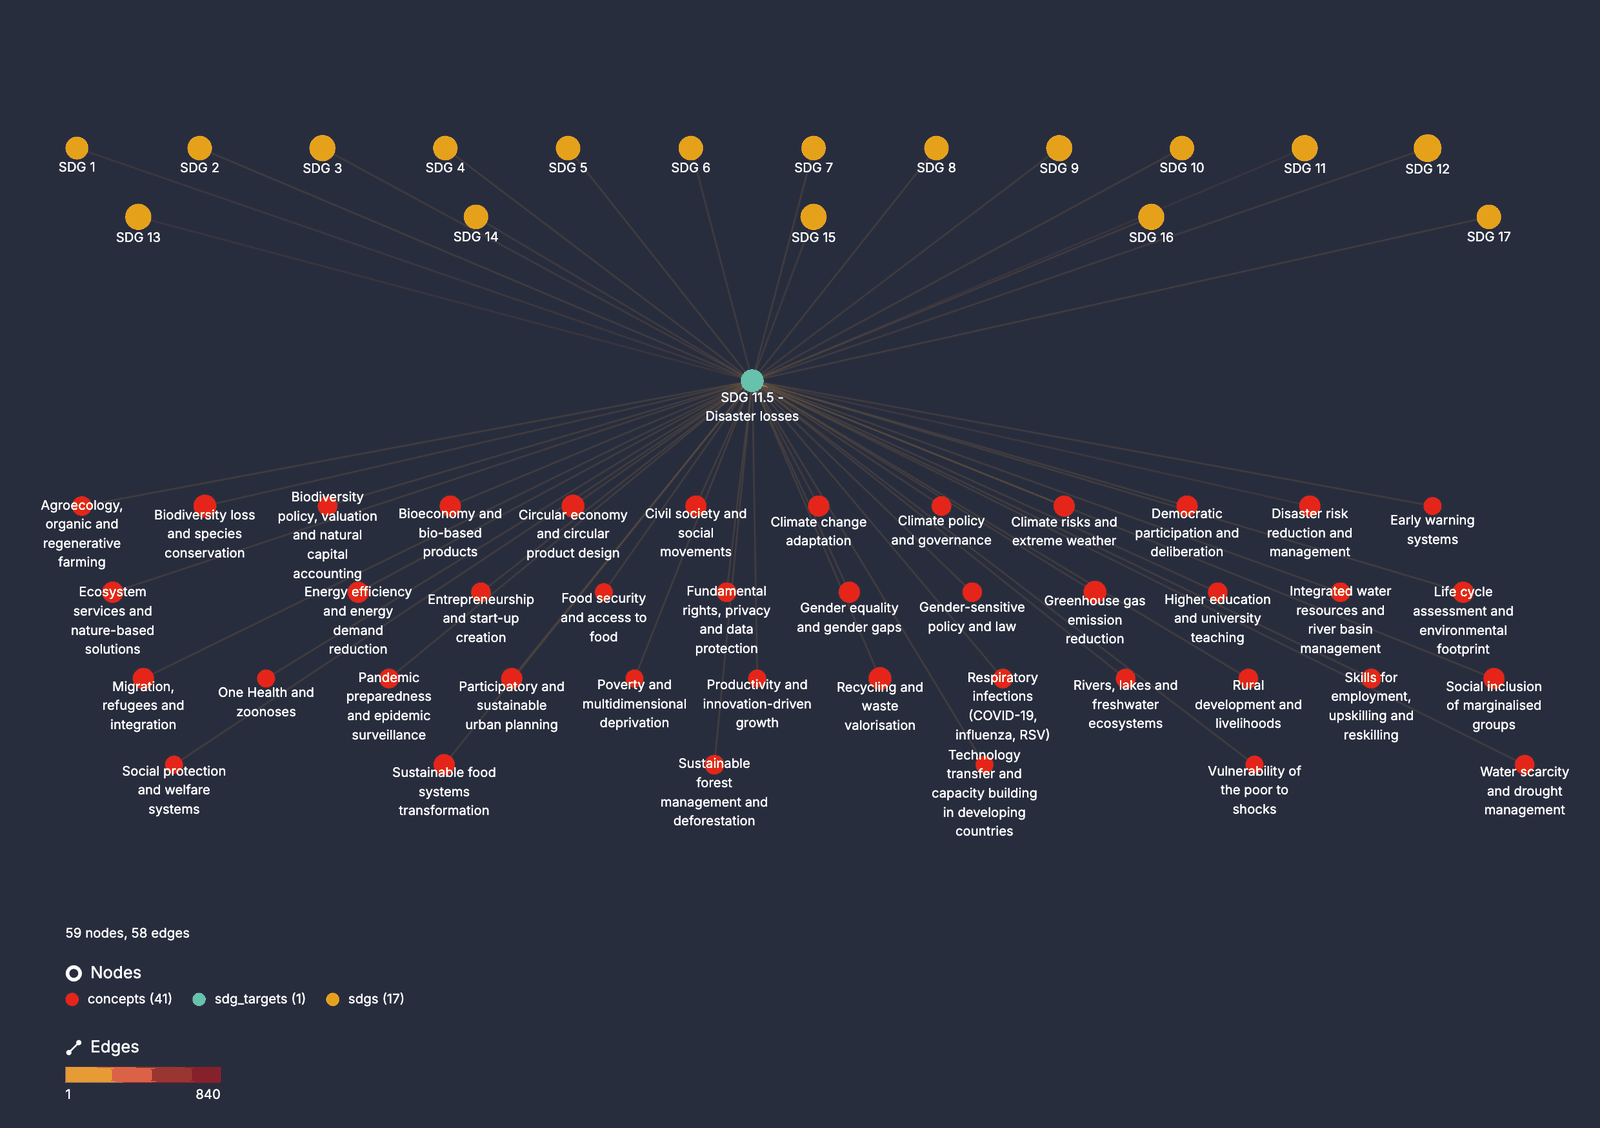
A target and everything it touches. The same move from a single target. SDG 11.5 (disaster losses) is expanded in both directions: upwards to the goals its projects also serve, all 17 of them, and downwards to its 41 concepts, from early warning systems to water scarcity and drought management. Disaster resilience is a cross-cutting subject, and the graph shows it at a glance.
 Open in Dtangle
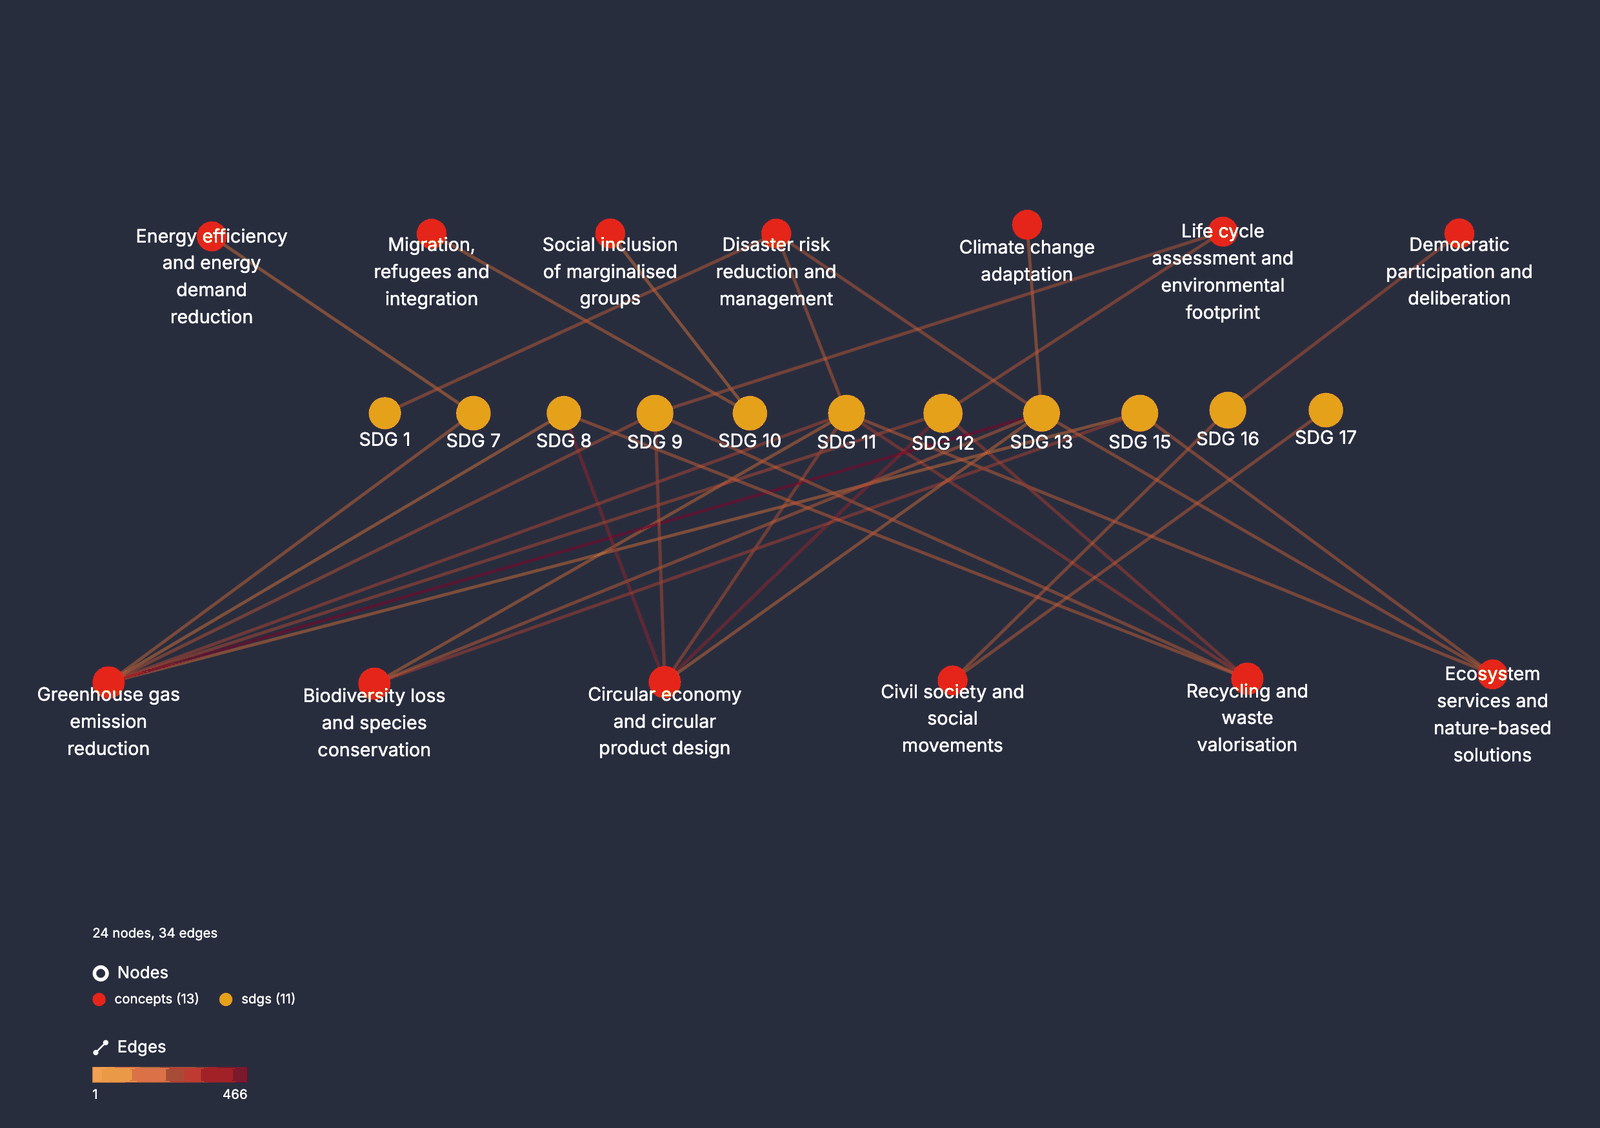
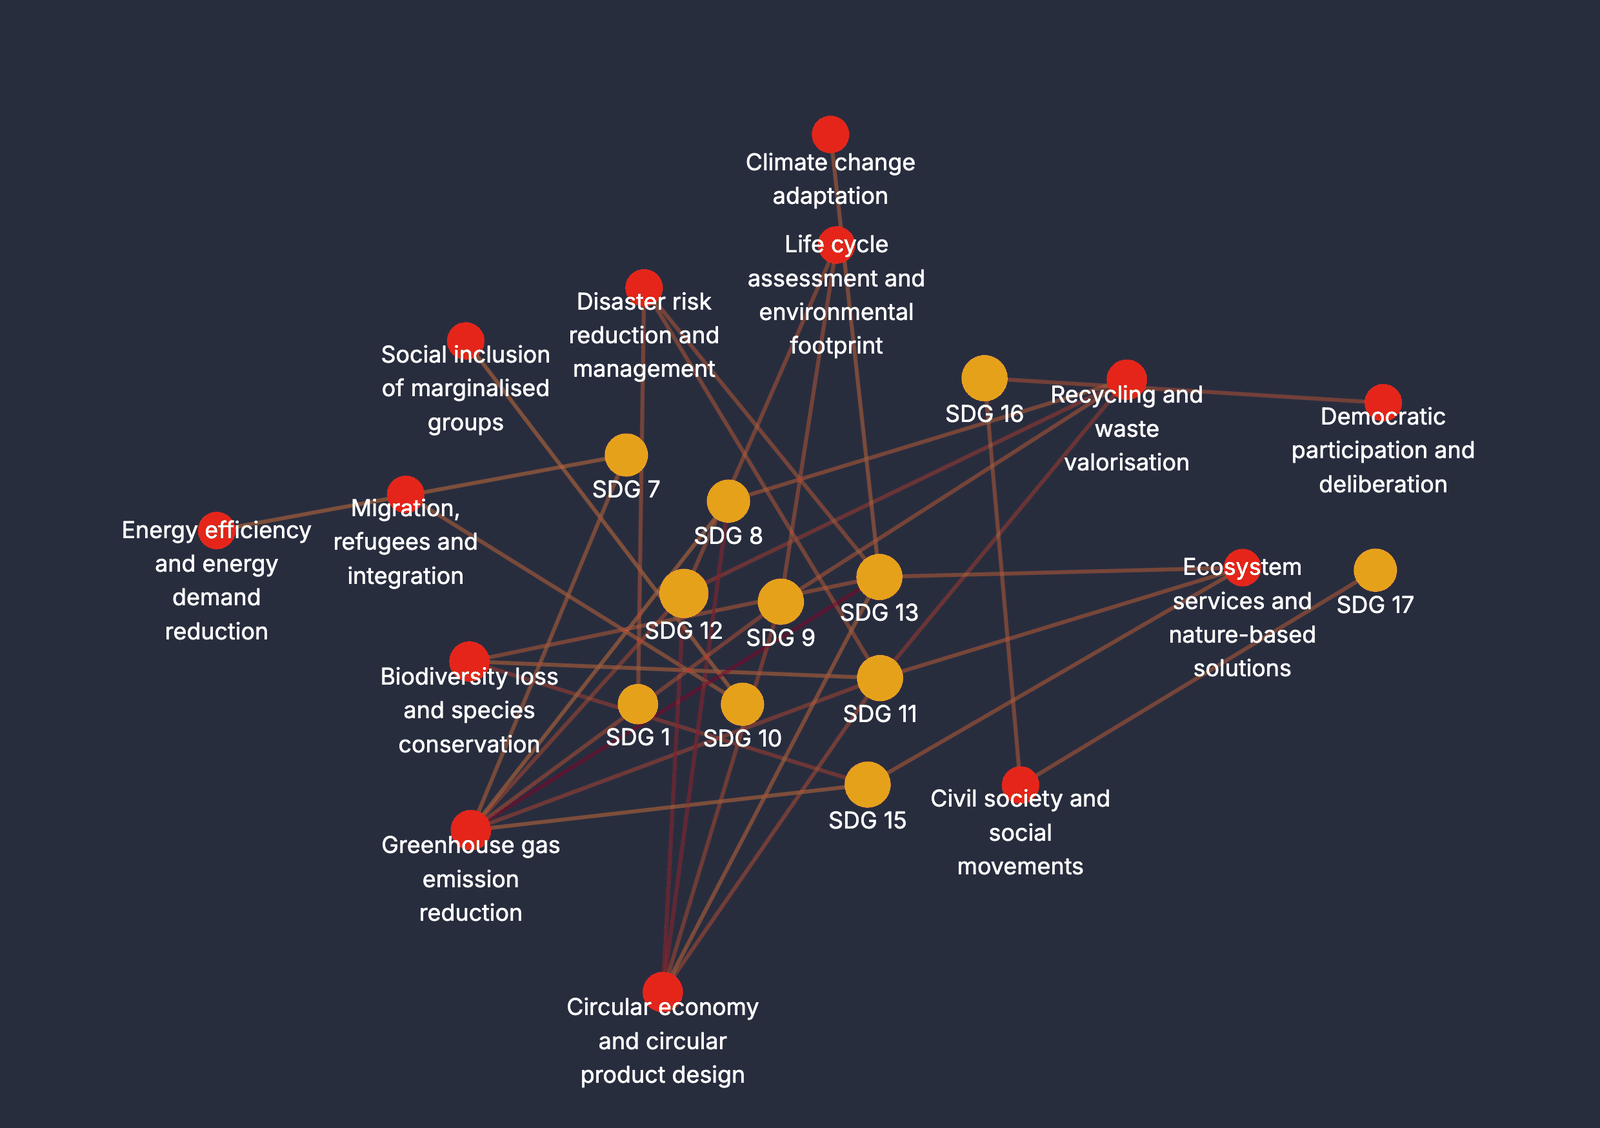
Concepts that serve several goals. Select a handful of concepts and ask which goals they reach. Greenhouse gas emission reduction alone connects SDG 1, 7, 8, 9, 10, 11, 12, 13 and 15; circular economy reaches SDG 8, 9, 11 and 12. The edge colour gives the number of projects, up to 466. This is the graph behind the pairs of goals in section 1: many of them are made by one concept serving two goals at once.
 Open in Dtangle
 Open in Dtangle
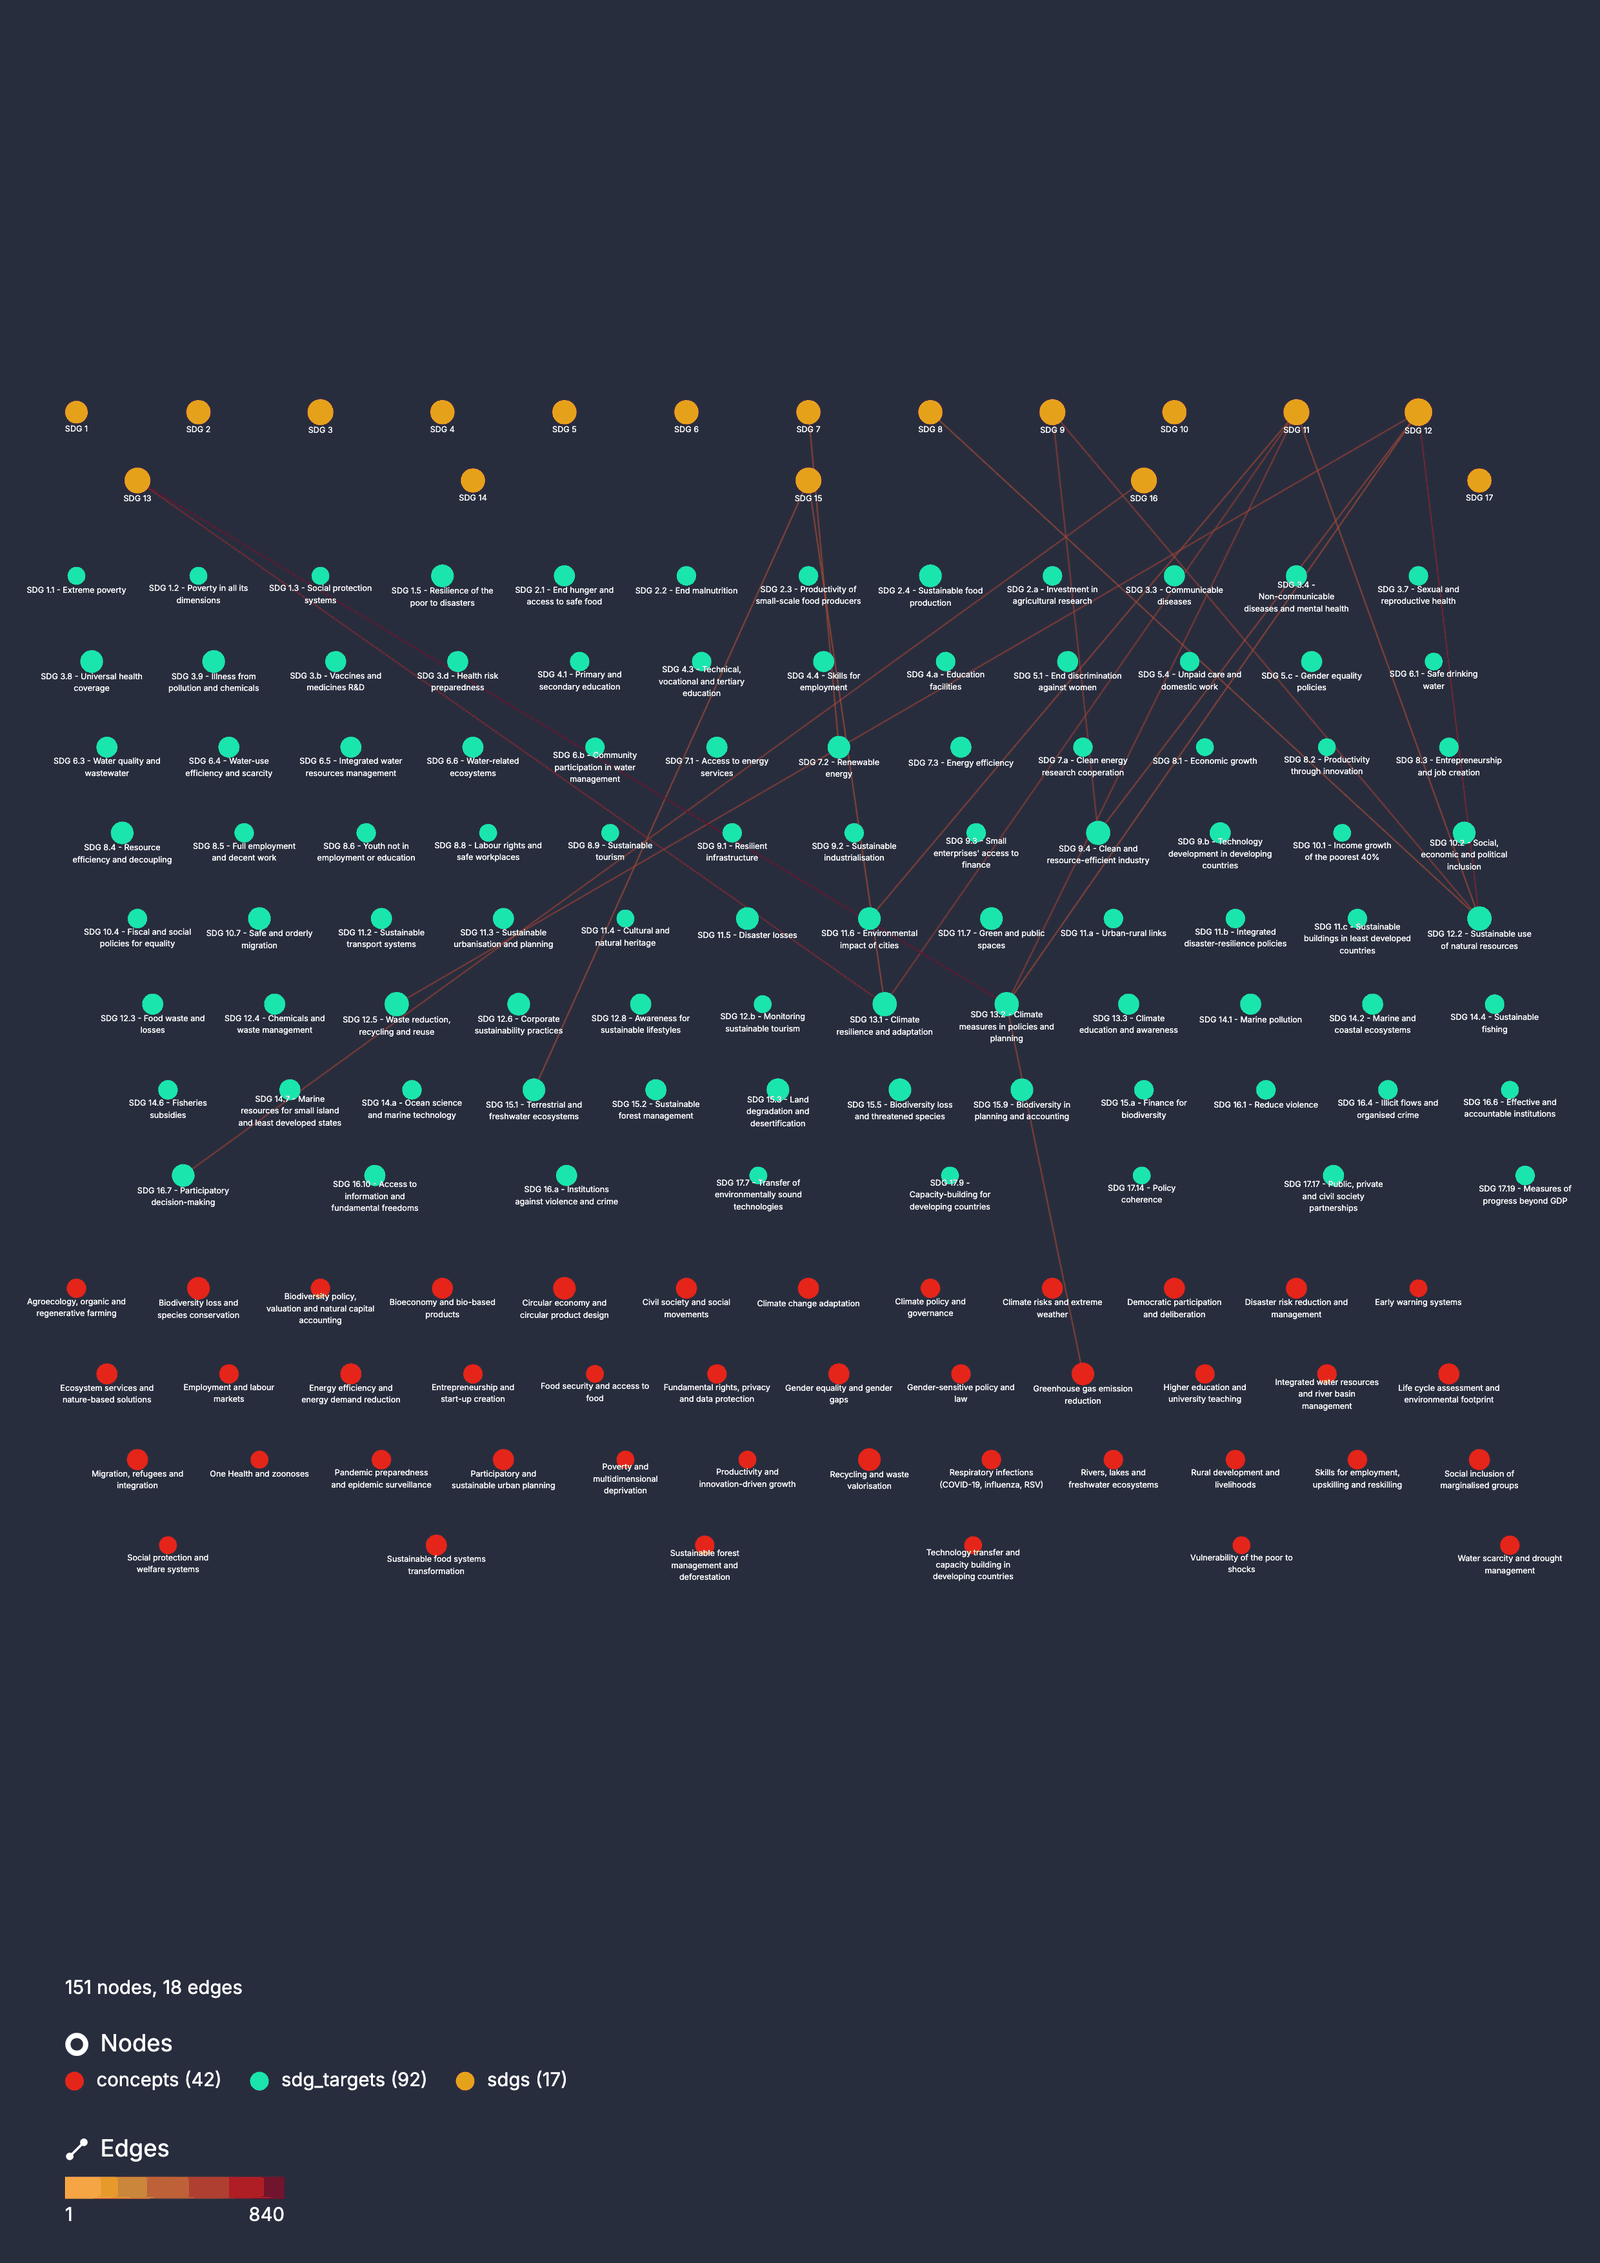
The whole study, filtered. Finally, the complete grid on one screen: the 17 goals, 92 of the targets and 42 concepts, with the edge-weight filter set high enough that only the 18 strongest links remain. Reading top to bottom: SDG 12 and 11 keep the most links to their targets; greenhouse gas emission reduction and circular economy are the concepts that still reach several targets.
 Open in Dtangle
4 · Evidence and coverage
Where the evidence comes from
Which fields and sentences of the projects the evidence comes from.
Most textual evidence comes from where a project states what it will do.
| Best location of the evidence | Links | Share |
|---|---|---|
| Aim sentence | 16,184 | 34.9 % |
| Method sentence | 10,716 | 23.1 % |
| Title | 9,989 | 21.6 % |
| Keywords | 5,610 | 12.1 % |
| Impact sentence | 3,655 | 7.9 % |
| Context sentence only | 93 | 0.2 % |
| Call topic title only | 68 | 0.1 % |
Projects without an SDG link
The 6,014 projects linked to no goal, and why.
6,014 projects (26 %) are linked to no goal at all: no concept is found in their text, and no structural signal is strong enough to place them on its own. The 17,104 projects with a concept link and 333 placed by a structural signal alone make 17,437 linked projects.
| Funding scheme | Not linked | Share of the scheme | Share of the not linked |
|---|---|---|---|
| MSCA fellowships and doctoral networks | 2,495 | 29 % | 41 % |
| ERC frontier research | 2,492 | 39 % | 41 % |
| Coordination and support actions (CSA) | 313 | 19 % | 5 % |
| European Innovation Council (EIC) | 278 | 19 % | 5 % |
| Research and innovation actions (RIA) | 245 | 9 % | 4 % |
| Joint undertakings | 121 | 14 % | 2 % |
| Innovation actions (IA) | 45 | 4 % | 1 % |
| Euratom | 19 | 31 % | 0.3 % |
| Other schemes | 6 | 8 % | 0.1 % |
| All projects | 6,014 | 26 % | 100 % |
Mostly fundamental research. 82 % of them are ERC or MSCA projects, such as “Flexoelectric control of magnetic textures in 2D oxide membranes” or “Mechanisms of co-translational assembly of multi-protein complexes”. They advance knowledge without addressing a goal, and giving them one would force the link. This is also why target 9.5 (enhance scientific research) is excluded: it would link every project and mean nothing. Applied projects are almost all linked: only 4 % of innovation actions and 9 % of research and innovation actions are not.
Some are genuine misses. “Perfect Vision”, adaptive eyewear for myopia, could belong to health (SDG 3), and “SCORPION”, on the safety of nuclear fuel cladding, arguably to energy (SDG 7). Their summaries use words that no alias covers, the limit described under Limitations and biases.
In funding, the projects without a link account for €11.7 bn of the €62.4 bn of EU contribution. The other €50.7 bn is what section 6 allocates.
5 · Go further
Studies in Dtangle and CSV
Ready-made studies to open in Dtangle, with the login, and the CSV files.
Everything above can be explored live. The studies behind the graph views are ready in the Dtangle visual analytics tool: open trials.dtangle.ch and sign in with the login cordis@dtangle.ch and the password sdgmap.
| Study | One row = | Shows |
|---|---|---|
| 1 · Goals, three series | a project with its goals; a goal with the goals it shares projects with | projects per goal, correlated goals (shared projects and lift, independent and raw; pairs also at broad level) |
| 2 · Targets, three series | a project with its targets; a target with the targets it shares projects with | correlated targets (independent and raw) |
| 3 · Targets and concepts | a target with its concepts, weighted by all projects, very pertinent projects and sum of scores (fine and broad) | the vocabulary of each goal |
| 4 · Projects and concepts, three series | a project and one of its concepts, with the targets and goals of that concept (series on the concept score: all, 2.00 and more, 4.00 and more) | which target comes from which concept (project → concept → target), weighted by the concept score |
To build your own file, use the Explorer tab: choose goals, filters and an analysis angle, and download a CSV ready for Dtangle. How every figure is computed and checked is in the Methodology.